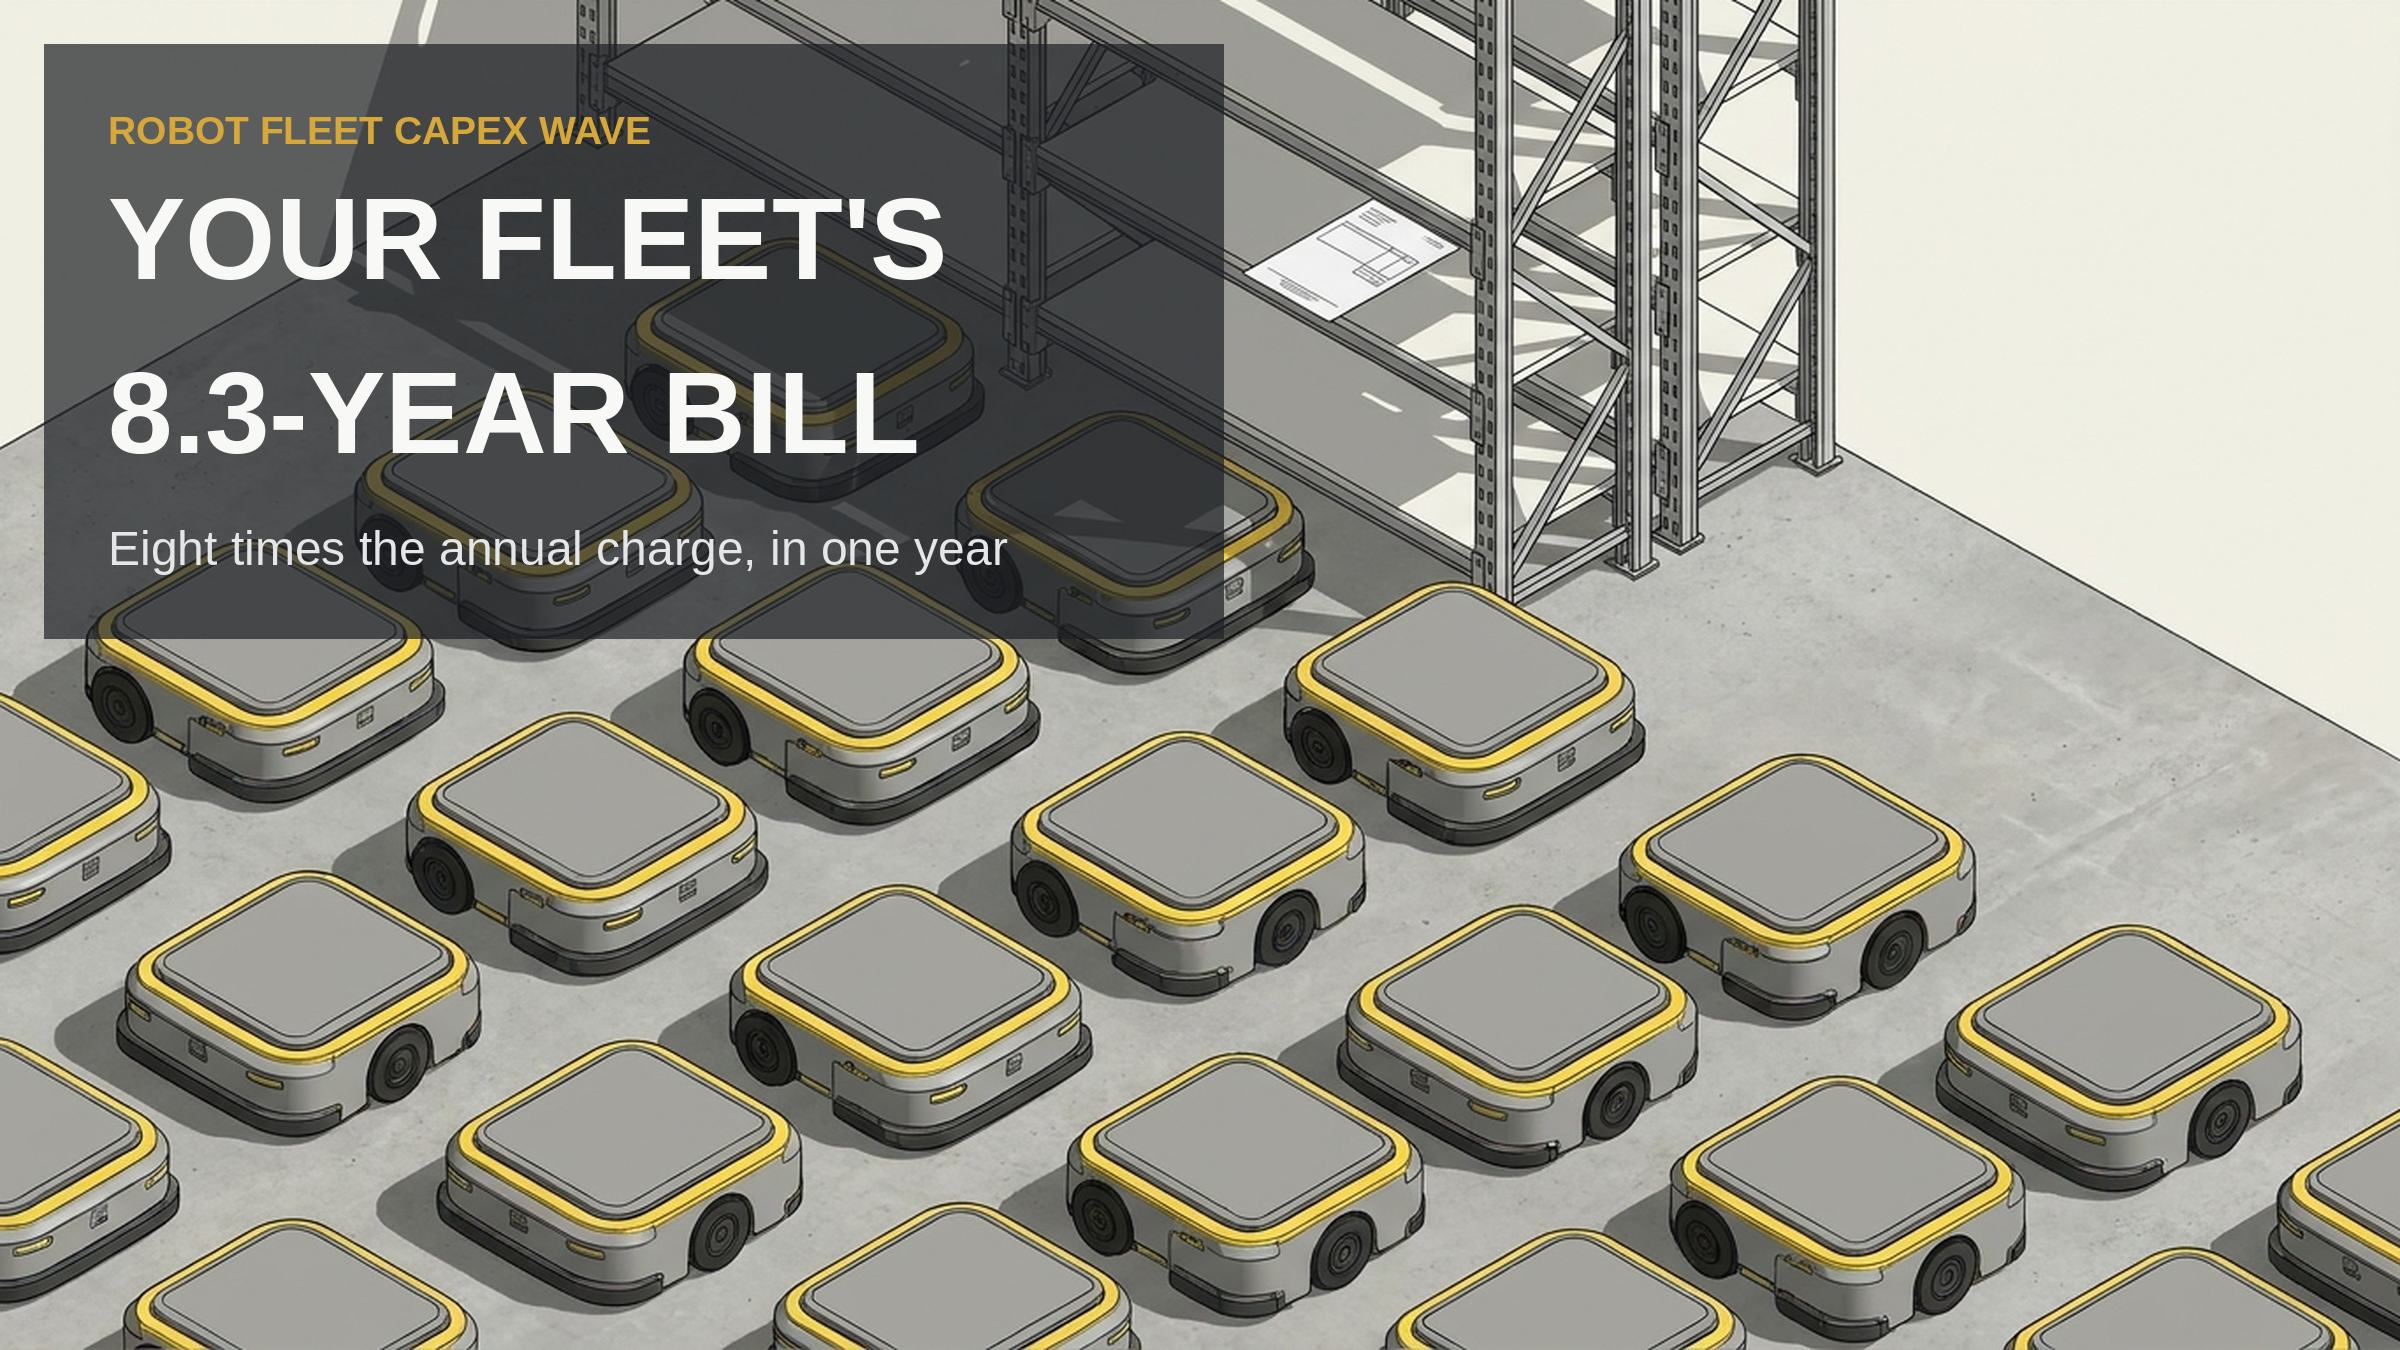
The robot fleet your board approved is the cheaper half of the purchase. A site that buys its machines in one year gets them back as one renewal bill around the eighth year, and that year carries about eight times the annual charge the business case spread over the fleet’s life. That is the wave nobody prices. The 8.3-year average replacement timeline in this year’s study sets the date, and sites have stretched it from 7.2 years in 2024. A longer stretch moves the bill later and makes it larger, because equipment prices keep climbing while the machines age.
At a glance
- The shift: Sites keep mobile equipment 8.3 years on average, so the second purchase arrives as one bill.
- The numbers: A third more than the invoice, at 3.5% a year. [3]
- The risk: A reserve at the original price covers three quarters of it.
The clock the case never sets
Three survey years and one price series carry this case. Replacement timelines ran 7.2 years in 2024, 7.9 in 2025 and 8.3 in the study fielded this August on 117 qualified responses [1]. The money went the other way over the same span. Sites now expect to spend $182,290 on a fleet in a year, down from $214,110 [1]. The building shows the same pullback. The share of sites planning to add warehouse square footage fell to 13% from 33% [2]. Capital is being held back everywhere, and the fleet is no exception.
A write-off schedule spreads the first invoice across years, and which schedule that invoice lands in is a separate argument. Cash cannot be spread that way. The machines arrive together, age together and fail together. However the schedule reads, the year the oldest units reach the average age brings one request for the whole fleet. A case that only ever priced the first purchase carries no reserves for it.
Stretching the life does not remove that year. It postpones the year and raises the price, because the units that reach the stretch are older and costlier to replace. I read the capital page twice before I believed it: moving from a 7.2-year to an 8.3-year cycle cuts the yearly charge on the same machine by about 13%, from 13.9% of its price to 12% [1]. The cost moves into repairs, downtime and longer spells out of warranty, and none of those lines sat in the request that was approved.
The same delay shows up in what sites do with the machines they retire. Thirty-eight percent hand them back to the dealer, 39% resell them, 35% store them in case they are needed later, and 14% strip them for parts [1]. A stored machine is capacity already paid for and no longer earning. That is the same problem in a smaller form, because the fleet is bigger than the work.
The replacement price is the other half of the case, and it is published. The producer price index covers the industrial truck, trailer and stacker machinery class, and it measures what domestic producers charge each month. The October reading was 383.858, against 379.526 in June [3]. That is 1.1% in four months, or about 3.5% a year at that pace. Over an 8.3-year life it puts the replacement about a third above the invoice you signed. A reserve funded at the original price covers about three quarters of the bill.
By the numbers
- 8.3 years: The average replacement timeline this year, up from 7.2 years in 2024 [1].
- $182,290: The average fleet spend sites now expect in a year [1].
- 35% of sites: The share that stores retired machines instead of selling them [1].
Where this bites
The people closest to the fleet already act as if the second purchase were a known date. They open trade-in talks when they order, they keep a parts bank, and 53% of buyers in the same study rank parts availability above the dealer tie [1]. That ranking is a hedge for the last years of a long stretch, when a machine still runs and its parts are out of production.
What I am watching is the December price release, which sets next year’s replacement cost. I am also watching the capital survey. If square-footage plans stay near 13%, sites are picking denser buildings over new ones, and a dense building renews more capital per square foot when its fleet ages out [2]. Neither number speaks to one machine. Together they sketch a network’s capital calendar in the years it is not buying.
The catch
A lift truck is a mechanical asset with a long parts tail, which is why the measured average is a fair reference for it. A robot’s life may be set by something else. The controller generation and the fleet software it must still talk to can end the run before the frame and the wheels do. If support stops at year six, the stretch is fiction, and the reserve is funding a machine the site will pull early.
The sum survives that objection, which is why I would keep it. Only the input changes. Set the reserve at capital divided by the life your own repair history supports, index it to the equipment price, and stagger purchases so the fleet never ages as one block. The wave is not optional. The year it lands is.
Related reading
- Your Stock Is the Cheaper Memory — more on Supply Chain & Operations
- Your Robot Adds a $12,260 Trap — more on Supply Chain & Operations
- 49.9% On Time: Shippers Stuck in the Gap — more on Supply Chain & Operations
Sources
- [1] Bridget McCrea, “2026 Lift Truck User Survey: Electric use grows, fleet quality matters,” Modern Materials Handling, August 2026 — https://www.mmh.com/article/2026_lift_truck_user_survey_electric_use_grows_fleet_quality_matters
- [2] Brian Albright, “Warehouse/DC Operations Survey 2026: Inventory improvements in focus,” Modern Materials Handling, November 2, 2026 — https://www.mmh.com/article/warehouse_dc_operations_survey_2026_inventory_improvements_in_focus
- [3] U.S. Bureau of Labor Statistics via FRED, “Producer Price Index by Industry: Industrial Truck, Trailer, and Stacker Manufacturing,” October 2026 — https://fred.stlouisfed.org/series/PCU333924333924