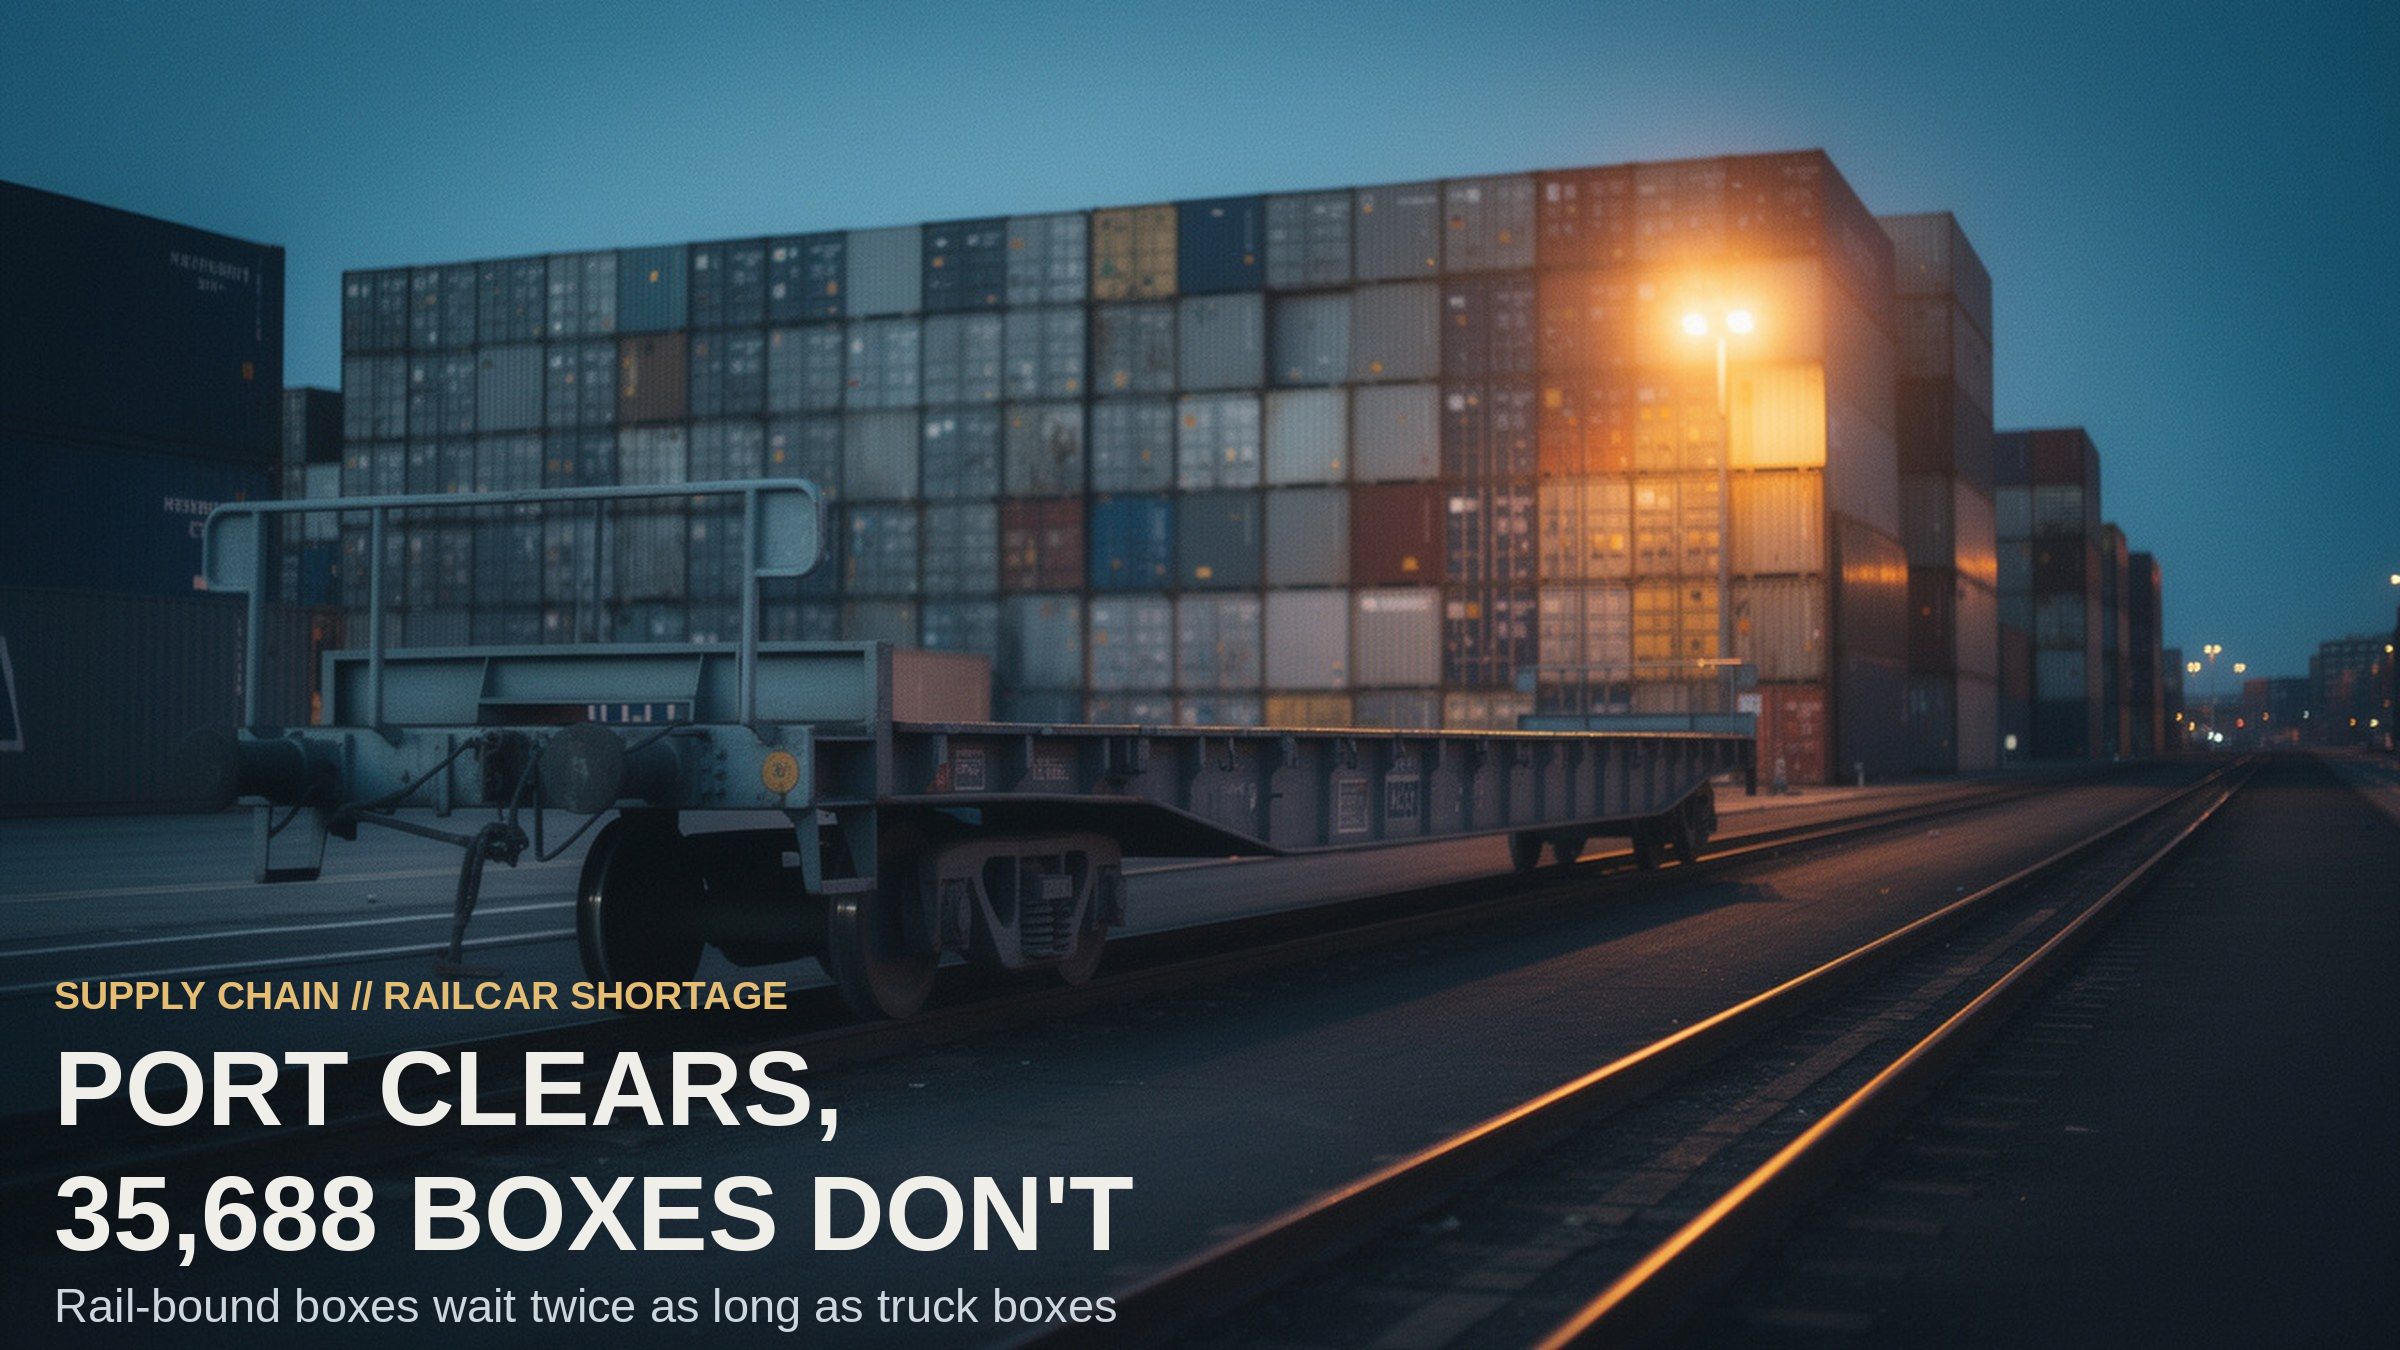
On the last Monday in October, 35,688 import containers sat on the terminals at Los Angeles and Long Beach waiting for a train, because the railcars that would carry them were in short supply. Your port clears what it is measured on: that same week, the queue tracker counted one ship waiting for a berth [1]. The boxes don’t: 10,562 of them had been on the dock at least nine days with no train called [1]. In the same quarter, tenants took 76.6 million square feet of warehouse space across the United States, four-fifths of it inland [2]. More of the freight now sits a thousand miles from the water, and the leg that carries it there is the leg now holding stock.
The constraint moved inland
The terminals’ own numbers say the water side is working. A box leaving by local truck waited 3.18 days in September, up from 2.95 in August. A box leaving by train waited 7.19 days, up from 6.75, according to Pacific Merchant Shipping Association data [1]. That is a gap of more than two to one between two boxes that arrived on the same vessel. At Los Angeles, 8,133 of the 19,626 rail-bound boxes had waited nine days or more, a 41.4% share. At Long Beach, the same cutoff caught 2,429 of 16,062, or 15.1% [1].
What I keep coming back to is how plain each number looks on its own and how badly the two ports disagree.
Both ports set monthly records in September, which is what put the stock in the yard. Los Angeles moved 1,042,652 twenty-foot equivalent units (TEU — the standard measure of container volume), up 18.07% on a year earlier. Loaded imports rose 18.62%, and empty boxes rose 20.40% [3]. Long Beach moved 997,177 TEU, its busiest month in 115 years and 25% above September 2025, with imports up 31.3% [4]. A record month used to show up as a line of ships at anchor. This one showed up as a yard full of boxes whose next move is a steel wheel.
The second report explains why the rail leg is the one that matters now. Cushman & Wakefield’s third-quarter national report counted the strongest three months of demand since early 2023, and put inland markets at 80% of the year’s take [2]. National vacancy fell to 6.8% from a 7.0% peak late last year, asking rents grew 4%, and only 64 million square feet was delivered in the quarter — 13% behind last year’s pace [2]. The demand is being housed inland, and the boxes in the yard are the ones that have to get there.
By the numbers
- 35,688 — Rail-bound stock: boxes waiting for an on-dock train at the two ports on Oct. 26, a count for one day rather than a queue length [1].
- 7.19 days — Rail wait in September: against 3.18 days for a box leaving by local truck, the widest split the September series shows [1].
- 80% — Inland share of warehouse demand: measured across the year to date by Cushman & Wakefield, with 203 million square feet taken nationwide [2].
What the rail side is doing
The operators closest to the yard are not describing a mystery. C.H. Robinson’s October market note named Southern California intermodal railcar shortages as the constraint and said limited equipment was stretching import dwell. Moving empty boxes was tying up the flows, while truck-bound freight moved near normal by comparison [1]. That is the shape of a car-supply problem rather than a demand problem, and it is why the two wait times above pull apart.
Capacity is being added at the far end of the same lane. Georgia opened an inland rail hub in late October with a stated plan to take 26,000 containers off the road [5], and Total Terminals International set a monthly rail record at Long Beach in September with 59,410 moves, nearly half its container volume [4]. My read is that these are the right projects aimed at the wrong quarter, because they add inland handling space while the delay sits in getting the cars back to the coast to load.
The other live risk is at the gate rather than the ramp. About 250 port watchmen at Los Angeles and Long Beach, roughly 2% of the dock workforce there, have worked without a contract since July 2025, and their terminals handle about 85% of Long Beach’s cargo [6]. Talks have already moved the strike deadline twice; that dispute is covered in why nine days of notice became a nine-day queue.
The catch
The 35,688 figure is a snapshot taken on one day, and the report that printed it says the count is not an average waiting time and does not show that every box in the yard is late [1]. What I find hard to square is how normal a nine-day wait has become in the trade. A yard holding a day’s arrivals is fine. A fifth of it sitting into a second week is the part that costs money, and only the age split tells you which one you have.
The inland share is also the landlord’s label, not a claim about cause. Cushman & Wakefield ties the shift to trade policy, nearshoring and steady consumer spending, and it names Houston, New Jersey, the Inland Empire, Savannah and Miami as port markets that improved in the quarter — not as the inland markets that drove the year [2]. The fair reading is that two separate measures point at the same leg of the chain; neither one proves the other caused it.
There is a third limit worth writing down. Long Beach’s empty boxes were 39.7% of its September volume, and Los Angeles’ were 35.6%. A record TEU month is partly a story about moving steel rather than goods [3][4]. That share tracks the trade rather than the record: Long Beach’s empty boxes grew 22.1% while its total rose 25%, so the empty share did not climb with the volume [4]. Anyone reading a port record as a demand signal should read the loaded import line instead.
At a glance
The shift: The bottleneck moved off the water to the rail ramp, where boxes wait for cars, not berths. The number: 10,562 of 35,688 rail-bound containers had sat nine days or more on Oct. 26. The risk: Rail wait runs twice truck wait, and inland demand keeps growing.
Related reading
- Your 9-Day Notice, 9-Day Queue — more on Supply Chain & Operations
- 7 Days Notice Rewrites Your Duty — more on Supply Chain & Operations
- Coast-to-Coast Rail Merger Clears First Big Test — more on Supply Chain & Operations
Sources
[1] FreightWaves, “Backlog grows as 35,000 containers await rail service at LA–Long Beach,” 2026-10-28 — https://www.freightwaves.com/news/backlog-grows-as-35000-containers-await-rail-service-at-la-long-beach [2] Cushman & Wakefield, U.S. Industrial MarketBeat, Q3 2026 — https://www.cushmanwakefield.com/en/united-states/insights/us-marketbeats/us-industrial-marketbeat [3] Port of Los Angeles, Container Statistics, September 2026 — https://portoflosangeles.org/business/statistics/container-statistics [4] Railway Age, “Port of Long Beach Sets All-Time Cargo Record in September,” 2026-10-19 — https://www.railwayage.com/news/port-of-long-beach-sets-all-time-cargo-record-in-september [5] FreightWaves, “New Georgia hub aims to take 26,000 containers off the road,” 2026-10-30 — https://www.freightwaves.com/news/new-georgia-hub-aims-to-take-26000-containers-off-the-road [6] Reuters, “Employer at Los Angeles and Long Beach seaports and maritime watchmen union agree to extend talks,” 2026-10-30 — https://www.reuters.com/business/world-at-work/employer-los-angeles-long-beach-seaports-maritime-watchmen-union-agree-extend-2026-10-30