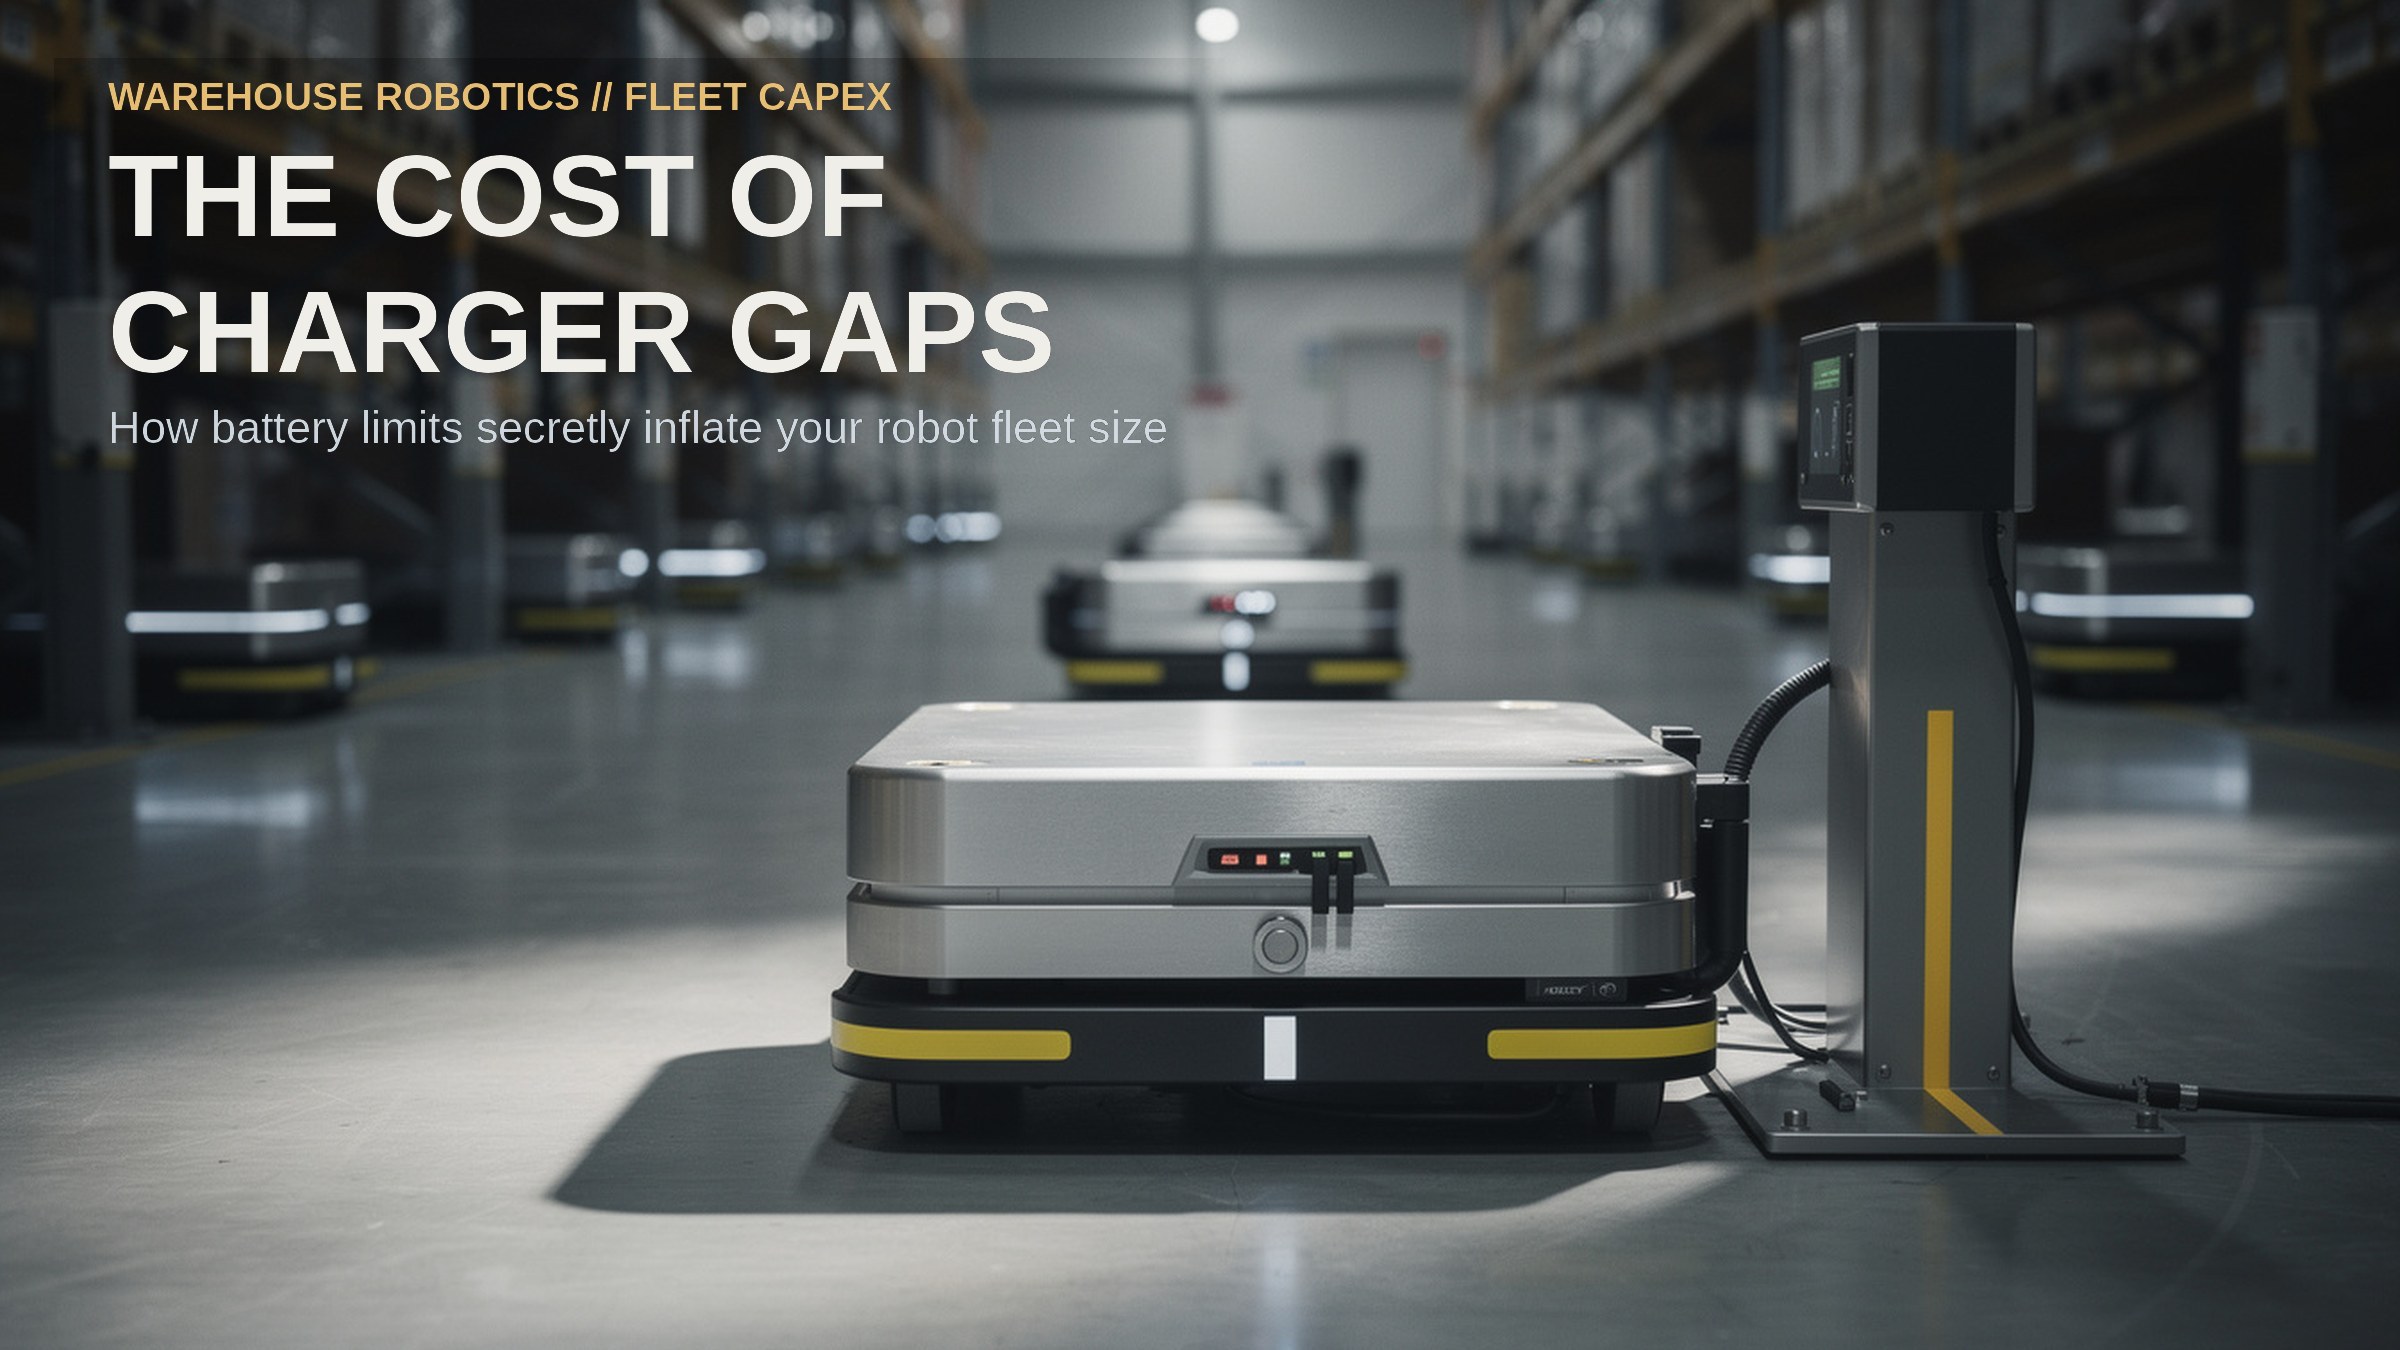
The machine on the quote works 6 hours 45 minutes at maximum payload, while a normal shift runs eight hours [1]. The 75 minutes in between are where capital requests quietly grow, because a fleet that cannot charge mid-shift must cover it with extra units. Your charger gap effectively buys 16 extra robots per 100 that mostly stand still. Put a charger on the route, and that penalty disappears.
The big picture:
The ratios this industry uses to size fleets come from model runs, and at least one of them ignores the battery entirely.
One of the papers behind these models states that the battery was never modelled: “for this work we assume the battery capacity to be infinite” [7]. That works for academic pod assignment, but it is a poor basis for sizing a fleet you will actually buy. Research in this space treats charging as a primary variable. One study modelled a robotic fulfilment system with charging and swapping built as queues. Their finding is blunt: “ignoring the battery recovery will underestimate the number of robots required and the system cost for more than 15%” [3][4]. A 2024 study went further into policy, weighing fast and slow charging against battery wear to find the charger count that hits a throughput target at the lowest cost [8].
What strikes me here is that two details on the data sheets matter more than the headline numbers. The summary block quotes the empty robot, while the detail block gives the loaded figure [1][2]. Payload is what shortens the day. A 1,350-kilogram machine runs 6 hours 45 minutes at maximum payload, against 9 hours 50 minutes empty [1]. A lighter 250-kilogram model runs 17 hours 30 minutes empty, against just 13 hours loaded [2]. A fleet sized on the brochure line is sized on a robot carrying nothing.
The heavy machine’s gap against a standard shift is small. Its charging ratio is 1:12, so ten minutes on a plug returns two hours of work [1]. Covering that 75-minute deficit needs about six minutes of charging. That is the whole difference between a charger on the route and a charger in the corner. One costs six minutes a shift, while the other costs machines because a robot that cannot top up has to be replaced by one that can.
The power bill is the smallest line in the case. A standard Level 2 unit delivers 7.2 kilowatts and needs its own 40-Amp circuit under Article 625 of the National Electric Code [5]. Commercial power averaged 13.41 cents a kilowatt-hour in 2025 [6]. Six minutes of charging is about 0.75 kilowatt-hours (kWh), or ten cents a robot-day and roughly 26 dollars a robot-year. Against a machine, that is noise. Against sixteen machines you did not need, it is the entire argument.
By the numbers
- 15% — Fleet under-count: skipping battery recovery under-counts the robots required and the system cost by more than 15% [3][4].
- 4.88% — Swapping ceiling: swapping beats plug-in charging by up to 4.88% on retrieval time, at a generally higher yearly cost [3][4].
- 3,000 cycles — Pack rating: the lowest full charging-cycle rating on both machines [1][2]. That equals about 20,250 hours of loaded work, which is near 9.7 years on one shift, 4.9 on two, or 3.3 on three.
- 7.2 kW — The charger: a Level 2 unit with its own 40-Amp circuit puts the commercial power cost near ten cents a robot-day [5][6].
What I’d watch:
My read is that the buyers who get this right ask for a different page of the data sheet. Loaded runtime, charging ratio, and cycle rating are all published, but none of the three appears on the sheet that reaches finance.
- Which figure the vendor quotes: the summary block is the empty-robot number on both pages I checked [1][2]. The loaded one sits a click down, and that distance spans the whole shift.
- Where the charger sits: a charger the robot passes during normal work turns the shift gap into a six-minute stop. A charger in a back corner turns it into detour time, paid for with machines.
- How policy impacts throughput: researchers put the recovery policy among the variables that move throughput time, with inductive charging performing best in tests [3]. That is a software setting and a floorplan choice, not a purchase order.
- Whether the pack is scheduled: the cycle rating is the only published number that dates the asset. It is missing from most capital models on this beat, and a two-shift building owns the same robot for a far smaller share of its rated life.
- How the ratio was built: the robots-per-station guidance traces back to model runs that assumed an infinite battery [7]. That means charging is an addition to the ratio, not something it already absorbed.
The catch
The part I keep circling is that the main study here is a queueing model, and its findings come from its own settings rather than your building. Read it as a direction and a size, not as a law you hand to a controller. The shift arithmetic in this piece is a separate quantity that lands nearby: 75 minutes of an eight-hour shift is 15.6%. The two must never be added, averaged, or presented as one finding [3].
The data sheets carry their own limits. Both robots are transport machines from one vendor, not the pod-carrying robots inside a grid [1][2]. A data sheet is not a benchmark of your fleet. The cycle rating has no published statement of how deep a cycle runs, so the hours above rest on an assumption I am stating: one full cycle equals one pack’s worth of loaded runtime. Change that assumption, and the years move.
Two costs sit outside the sum. A charger on the route needs its own circuit and floor space, which is site work with its own lead time [5]. The commercial power figure is also a national average [6]. It leaves out the demand charges and time-of-use rates a building actually pays, which barely matters here because the power line is small either way. What is not small is buying machines to cover a charging gap that a siting decision could have closed.
The sizing rule that sits upstream is in the pick-station model, the other half of this equation. That piece sets how many robots a station can keep busy, while this one sets how many are free to be kept busy.
At a glance
- The Big Shift: fleet sizing is moving from a ratio a vendor supplies to an uptime count an operator can check. The published duty cycle of a battery-powered robot is now specific enough to set against a shift.
- Why It Matters: the gap between a reachable charger and a distant one is a double-digit share of the fleet. The machines bought to cover it are capital that never earns throughput.
- What I’d Watch:
- Loaded runtime: the run time published against maximum payload, not the empty-robot figure, because payload shortens the working day.
- Charging ratio: minutes of charging needed to return an hour of runtime, which decides whether charging on the route is practical.
- Cycle rating: the pack’s rated full-charge count, the one published number that puts the asset’s life on a calendar.
- Recovery policy: whether charging is prioritised or dedicated, and where chargers sit relative to the robots’ normal paths.
- The Catch: the fleet penalty comes from a queueing model whose settings are not yours. The cycle rating has no published depth, and a charger on the route is still site work with a circuit to install.
Related reading
- Amazon Builds the Robots; Walmart Builds for What They Can’t… — more on Supply Chain & Operations
- $200,000 Robots: Your Seller Won’t Stay — more on Supply Chain & Operations
- $62M Says You Never Buy Robots — more on Supply Chain & Operations
Sources
[1] MiR1350 specifications, Mobile Industrial Robots — https://mobile-industrial-robots.com/products/robots/mir1350/specifications [2] MiR250 specifications, Mobile Industrial Robots — https://mobile-industrial-robots.com/products/robots/mir250/specifications [3] Zou, Xu, Gong & De Koster, “Evaluating battery charging and swapping strategies in a robotic mobile fulfillment system”, European Journal of Operational Research 267(2):733-753 (2018), abstract record on RePEc — https://ideas.repec.org/a/eee/ejores/v267y2018i2p733-753.html [4] Same study, abstract record on Erasmus University Rotterdam (Pure) — https://pure.eur.nl/en/publications/evaluating-battery-charging-and-swapping-strategies-in-a-robotic- [5] U.S. Department of Energy, Alternative Fuels Data Center, “Electricity Stations” — https://www.afdc.energy.gov/fuels/electricity-stations [6] U.S. Energy Information Administration, “Prices and factors affecting prices” — https://www.eia.gov/energyexplained/electricity/prices-and-factors-affecting-prices.php [7] Xie, “From Simulation to Real-World Robotic Mobile Fulfillment Systems” (arXiv:1810.03643v1, 2018) — https://arxiv.org/html/1810.03643v1 [8] Chen, Gong, Chen & Wang, “Does battery management matter? Performance evaluation and operating policies in a self-climbing robotic warehouse”, European Journal of Operational Research 312(1):164-181 (2024), abstract record on RePEc — https://ideas.repec.org/a/eee/ejores/v312y2024i1p164-181.html