
Stop Blaming Demand Planning for Stockouts
Manufacturers routinely celebrate a 96% Case Fill Rate on Friday while retailers hit them with compliance chargebacks on Monday.
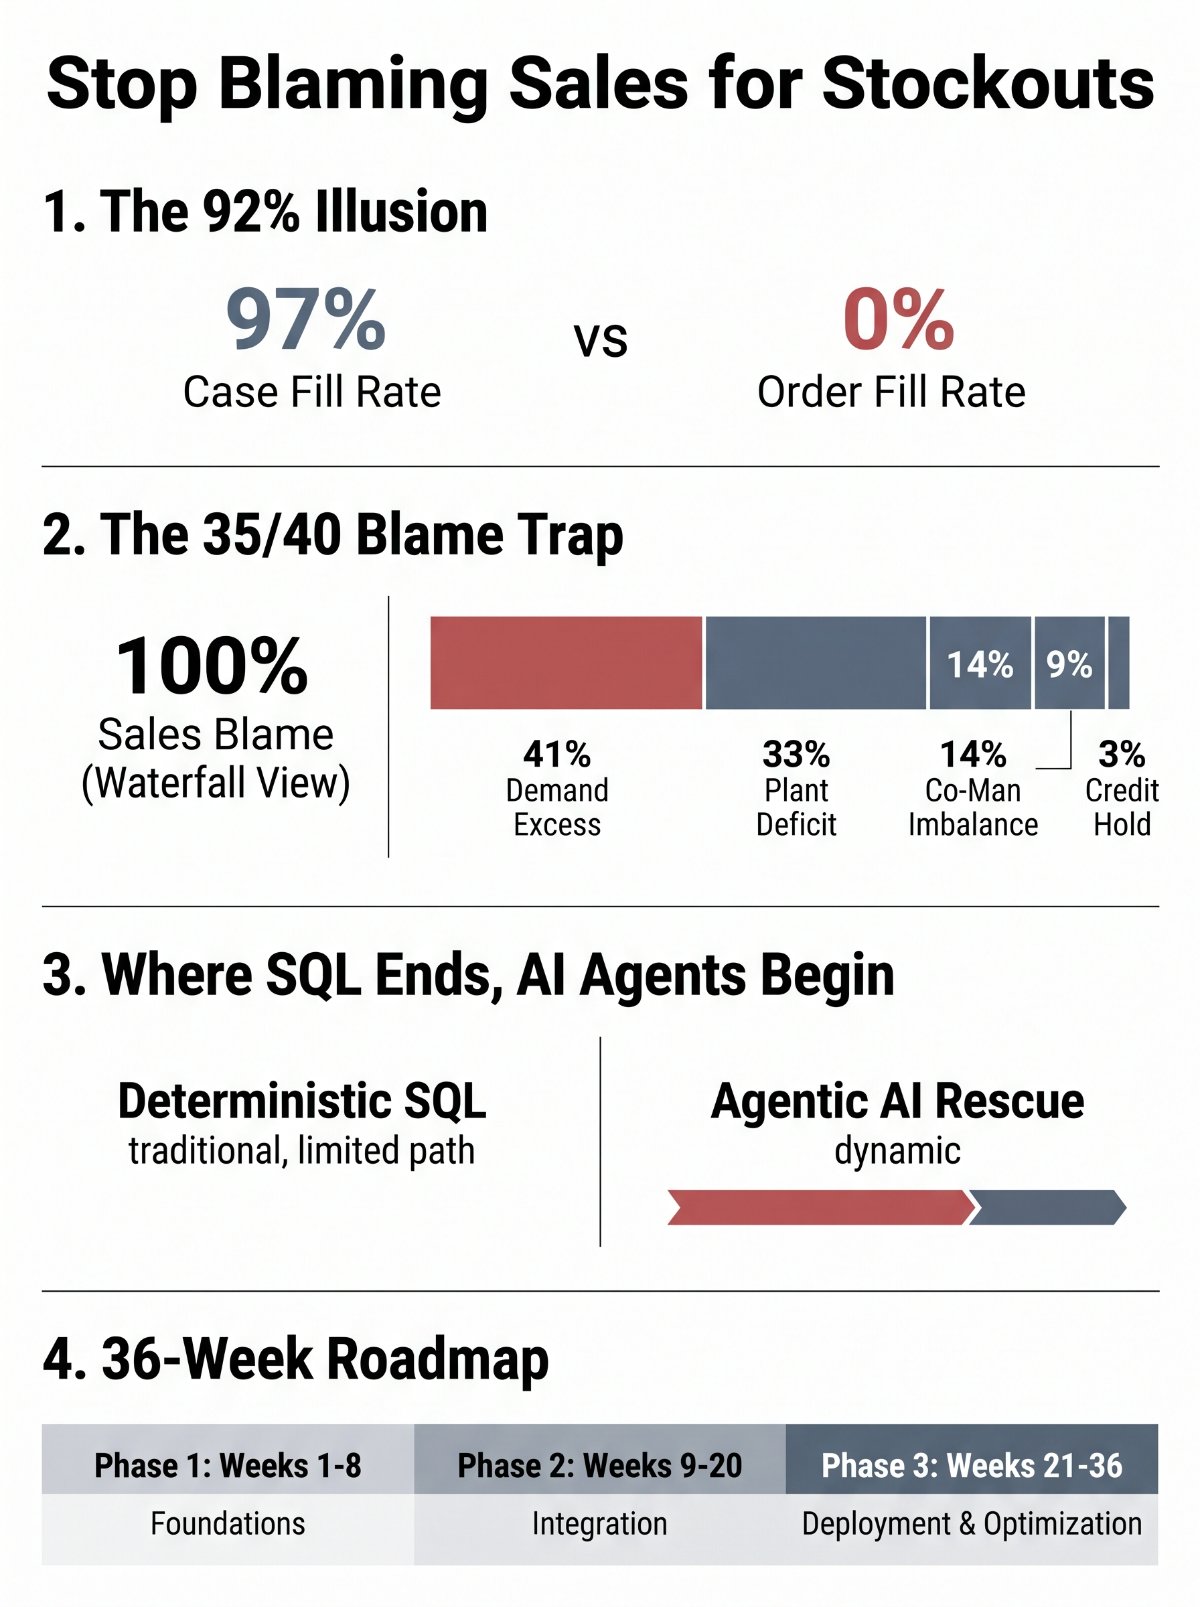
Why it matters: A single missing promotional SKU turns a 97% Case Fill Rate into a 0% Order Fill Rate—and triggers automatic On-Time In-Full (OTIF) penalties. Yet most executives misdiagnose these cuts because they rely on flawed ERP blame rules that hide factory bottlenecks made two to eight weeks earlier.
The 92% illusion:
-
Case Fill Rate (CFR) measures total cases shipped vs. ordered—a volume metric that hides chronic single-line cuts.
-
Order Fill Rate (OFR) measures orders shipped 100% complete on the first attempt—the exact standard retail buyers use to issue fines.
-
When CFR sits at 96% but OFR drops to 75%, you do not have a capacity problem. You have a synchronized availability problem sitting two to eight weeks upstream.
3 hidden leaks draining your fill rate:
-
1. The ERP “Symptom Switch”: When an order cuts, the ERP stamps “No Inventory at DC” without knowing why the bin is empty. Worse, IT scripts that overwrite that live transactional field overnight trigger unauthorized EDI messages to buyers, corrupt credit logs, and generate automated retailer fines.
-
2. The 35/40 Blame Trap: Suppose a buyer orders 35% over forecast the same week a plant under-produces by 40%. Sequential “waterfall” reporting trips the demand threshold first—blaming Sales or Demand Planning for 100% of the cut and starving the broken factory line of capital.
-
3. Monday Morning Cannibalization: First-come, first-served ERP rules let a single 6:00 a.m. Monday big-box order wipe out regional warehouse stock for the week. When you cut a major retailer’s order by 400 cases in Week 1, their algorithm automatically re-orders those exact 400 cases on top of Week 2—creating an “Echo Spike” that looks like a forecast error.
The fix
Move root-cause math out of the live ERP into an external Proportional Attribution Ledger and turn on automated pre-confirmation guardrails.
-
Split the blame accurately: Every cut case must be divided across all upstream drivers in exact proportion to their 2-to-8-week deviation. In the 35/40 scenario, proportional math proves 59% of the lost volume sits upstream of Sales—across internal plant deficits (33%), co-man lag (14%), regional DC imbalance (9%), and credit holds (3%).
-
Cap Monday surges: Set automated allocation ceilings inside your order-promising engine to confirm a buyer’s fair weekly share at 6:00 a.m. and hold excess volume for review—preserving stock for the rest of the market.
Where SQL ends, AI agents begin:
Deterministic SQL ledgers handle the exact attribution math, but they are blind to unstructured chaos—like a co-manufacturer’s emailed delay notice or a carrier weather alert. Leading teams pair deterministic guardrails with an agentic reasoning layer to stop cuts before the rejection notice fires:
-
Deterministic SQL (The Math): Calculates the exact proportional attribution split and enforces hard Monday morning allocation ceilings with zero hallucination risk.
-
Unstructured Forensics (The Context): AI agents ingest supplier emails, QA holds, and raw material logs to flag a co-manufacturer delay weeks before the ERP sees a short receipt.
-
Autonomous Order Rescue (The Trade-off): When an order faces a cut, an agent calculates the retailer’s OTIF fine vs. cross-DC expedited freight cost, clears routine credit blocks, and routes a one-click rescue approval to the planner in under five minutes.
The 36-week executive roadmap:
You do not need a three-year ERP overhaul to plug these leaks. Execute three 12-week, phase-gated sprints over your existing cloud data lake and ERP controls:
-
Phase 1 (Weeks 1–8) — See the Truth: Halt nightly ERP rejection-code overwrites, stand up the Proportional Attribution Ledger and Echo-Spike detector, and sync promo calendars daily. Payoff: Zero EDI/credit disruptions and a 30–40% drop in uncommunicated promo stockouts.
-
Phase 2 (Weeks 9–20) — Protect Monday Inventory: Turn on automated customer allocation caps, enable cross-DC stock substitution, and connect co-manufacturer component tracking. Payoff: +4 to 6 points in Case Fill Rate/OTIF and a 24% cut in expedited freight.
-
Phase 3 (Weeks 21–36) — Automate Rescue: Link raw material delays directly to open orders and deploy AI agents to balance freight vs. OTIF fines before orders reject. Payoff: 50%+ faster exception resolution and automated revenue protection.
The bottom line:
Before approving next quarter’s supply chain budget, ask your leadership team three questions:
-
Are we overwriting live ERP rejection codes? Freeze it today and move root-cause math to an external analytical ledger.
-
Do waterfall rules hide plant failures behind demand spikes? Require a proportional attribution split before funding another planning tool.
-
Are planners manually triaging Monday stockouts? Pair automated allocation caps with AI rescue agents to protect inventory before confirmation.
Up next in Part 2 (The Practitioner & Architect’s Blueprint): We open the hood on the exact business signals to extract across demand, production, and POS horizons, the deterministic SQL behind the proportional ledger, and how to wire AI rescue agents to your ERP guardrails.