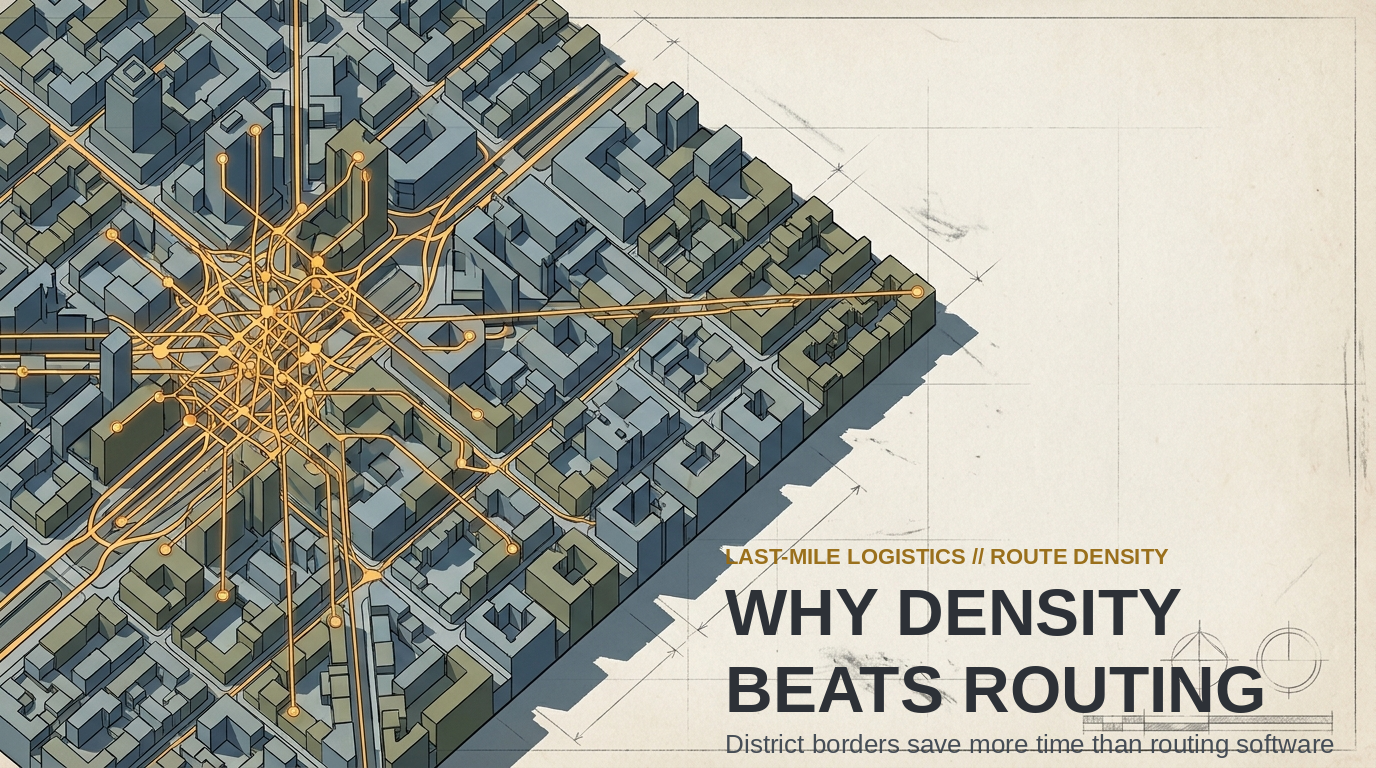
Your route’s 5x stop gap sits in the one choice a routing tool never makes: how tight the district is. The last-mile data set Amazon released for its routing research challenge shows routes holding 50 to 250 stops, a 5x spread in what one van-day is asked to absorb [1]. Density beats routing the moment that gap exists, because software can only sort the list it receives.
The big picture:
My read starts with how those routes were graded. Of the 6,112 routes drivers actually ran, the challenge grader marked 2,718 high quality, 3,292 medium and 102 low [2]. The order a driver picked was often not the best one, and better math cannot fix a stop list that was thin, spread out or split across two postal codes.
What shapes the list is local knowledge of tight areas. A 2026 review in the European Transport Research Review credits Raghavan and Zhang with a finding: using drivers’ experience in dense areas cut route time by 35.8% on average [3]. The same passage describes the district that does the work — sized to the daily workload, tight enough to cut travel, borders clear so routes do not cross [3].
That is a map choice, not a routing one. Software sorts the stops inside a single route, but it cannot merge two half-empty districts or hand a driver the same streets for a second month. The review puts the limit plainly: route quality “is not defined solely by its duration or cost”, but by street layout, local rules and customers that a solver struggles to model [4].
The spread is older than this year’s software pitch, too. The corpus behind it covers 9,184 routes Amazon drivers ran in 2018, across five United States cities [5]. What it describes is real operations, not a release note.
The cost adds up quickly. Light truck drivers made a median $21.57 an hour in the 2025 survey [6], and 72% report working past 40 hours a week [7]. Take a 150-stop route: at 18 stops per driver-hour it takes 8.33 hours, and at 22 it takes 6.82 hours. The 1.52 hours saved, priced at $21.57, is $32.68 a van-day.
By the numbers
- 50 to 250 stops — The route gap: A 5x spread in the work one van is asked to absorb, measured across 6,112 training routes in the published data set [1].
- 35.8% — The density gain: The average route-time cut that the 2026 review credits to Raghavan and Zhang’s work on driver experience in dense areas [3].
- 2,718 of 6,112 — High-quality routes: The count the challenge grader marked high quality, against 3,292 medium and 102 low, so the order a driver ran was often not the good one [2].
- $21.57 — The van-hour floor: The 2025 median hourly wage for light truck drivers, 72% of whom report a typical week of more than 40 hours [6][7].
What I’d watch:
The people closest to this problem are not comparing software tools; they are arguing about map borders, and I think they are looking at the right thing.
- The baseline stop count: A route holding 50 stops and one holding 250 are two different products with distinct cost bases [1], so I’d want that count on the table before anyone tests new code.
- The real-world grade: The corpus graded the order drivers physically ran [2], which means a network that only tracks planned miles never learns whether its plan survived the day.
- The knowledge cost of a re-draw: That 35.8% cut rests on drivers knowing their own streets [3], so rotating everyone through new territory trades local speed for a gain on paper.
- The pricing of hours: One regional parcel carrier we hold a field note on lifted stops per driver-hour from 18 to 22 across 140 vans on dynamic routing, with miles down 16% and a 5.4x return on the licence [8]. The stop gain carried that case; the miles were the side effect.
- The length of the week: With 72% of light truck drivers already past 40 hours [7], a saved hour tends to come off overtime rather than land as slack.
The catch
I would not put that 35.8% on a board without its owner. It is Raghavan and Zhang’s finding, reported inside the 2026 review, and as far as the pages show it was not measured again by the paper citing it [3].
The 50-to-250 band says what those 2018 routes carried, not what a route should carry, and it is not a target [1][5]. A tight district that lifts stops per driver-hour can still add minutes at every door, and a route that saves an hour can hand that hour back as unpaid waiting.
The wage is a median from a survey [6], not a loaded cost. Benefits, vans, depots and managers sit outside it, which makes the $32.68 a floor on what the saved time is worth rather than the whole bill.
What survives all of that is narrow, and I think durable: the stop set is a base-map choice, the order is a by-product, and a district drawn badly cannot be routed back into shape.
At a glance
- The Big Shift: Amazon’s published last-mile data shows routes holding 50 to 250 stops, and the measured route-time lever is driver knowledge of tight districts, worth 35.8% on average, rather than the order of the list.
- Why It Matters: A routing tool only sorts the stops it is given. If the stop set is thin, spread out or freshly rotated, the software is working on a map choice it never made, and the van-hour it costs runs at a $21.57 median.
- What I’d Watch: How networks balance software plans against local driver knowledge when they draw districts.
- The stop count: The number of drops one van takes, which sets the base cost before any code runs.
- The real-world grade: Whether the order drivers actually ran was the best one, which is what planned-mile reports hide.
- The re-draw cost: The local speed a driver loses when map borders move.
- The Catch: The 35.8% is a cited finding inside a 2026 review of 2018 routes in five cities, and the $21.57 median understates the loaded cost of a van-hour, so $32.68 a day is a floor.
Related reading
- Sticker Price Lies — more on Supply Chain & Operations
- Your Golden Zone Costs 10 Miles — more on Supply Chain & Operations
- OpenAI’s custom chip beats Nvidia on power
Sources
[1] Li, He and Zhang — “Learning from Drivers to Tackle the Amazon Last Mile Routing Research Challenge” (arXiv:2205.04001v2; 6,112 training and 3,052 evaluation routes; each route contains a set of 50 to 250 stops) — https://arxiv.org/html/2205.04001v2 [2] Same source — quality grading of the executed sequences: “Out of the 6,112 actual sequences, 2,718 are of high quality, 3,292 are medium, and 102 are low” — https://arxiv.org/html/2205.04001v2 [3] European Transport Research Review (2026) — “A decision tree-based algorithm for the Amazon last-mile routing research challenge” (Raghavan & Zhang’s 35.8% average route-time reduction from driver experience in dense areas; district balance, compactness and contiguity; the demand-uncertainty and familiarity trade-off) — https://link.springer.com/article/10.1186/s12544-026-00795-4 [4] Same source — “The quality of a route is not defined solely by its duration or cost, but by a multitude of additional factors related to geography, infrastructure, and customers” — https://link.springer.com/article/10.1186/s12544-026-00795-4 [5] Same source — the data set covers 9,184 historical routes performed by Amazon drivers in 2018 — https://link.springer.com/article/10.1186/s12544-026-00795-4 [6] O*NET OnLine, United States Department of Labor — 53-3033.00 Light Truck Drivers (median wages 2025: $21.57 hourly, $44,860 annual) — https://onetonline.org/link/summary/53-3033.00 [7] Same source — Duration of Typical Work Week: 72% responded “More than 40 hours” — https://onetonline.org/link/summary/53-3033.00 [8] Editorial-Factory field notes, last_mile_routing_fleet_carbon Anecdote 1 (internal) — context/growth_os/customer-truth.md