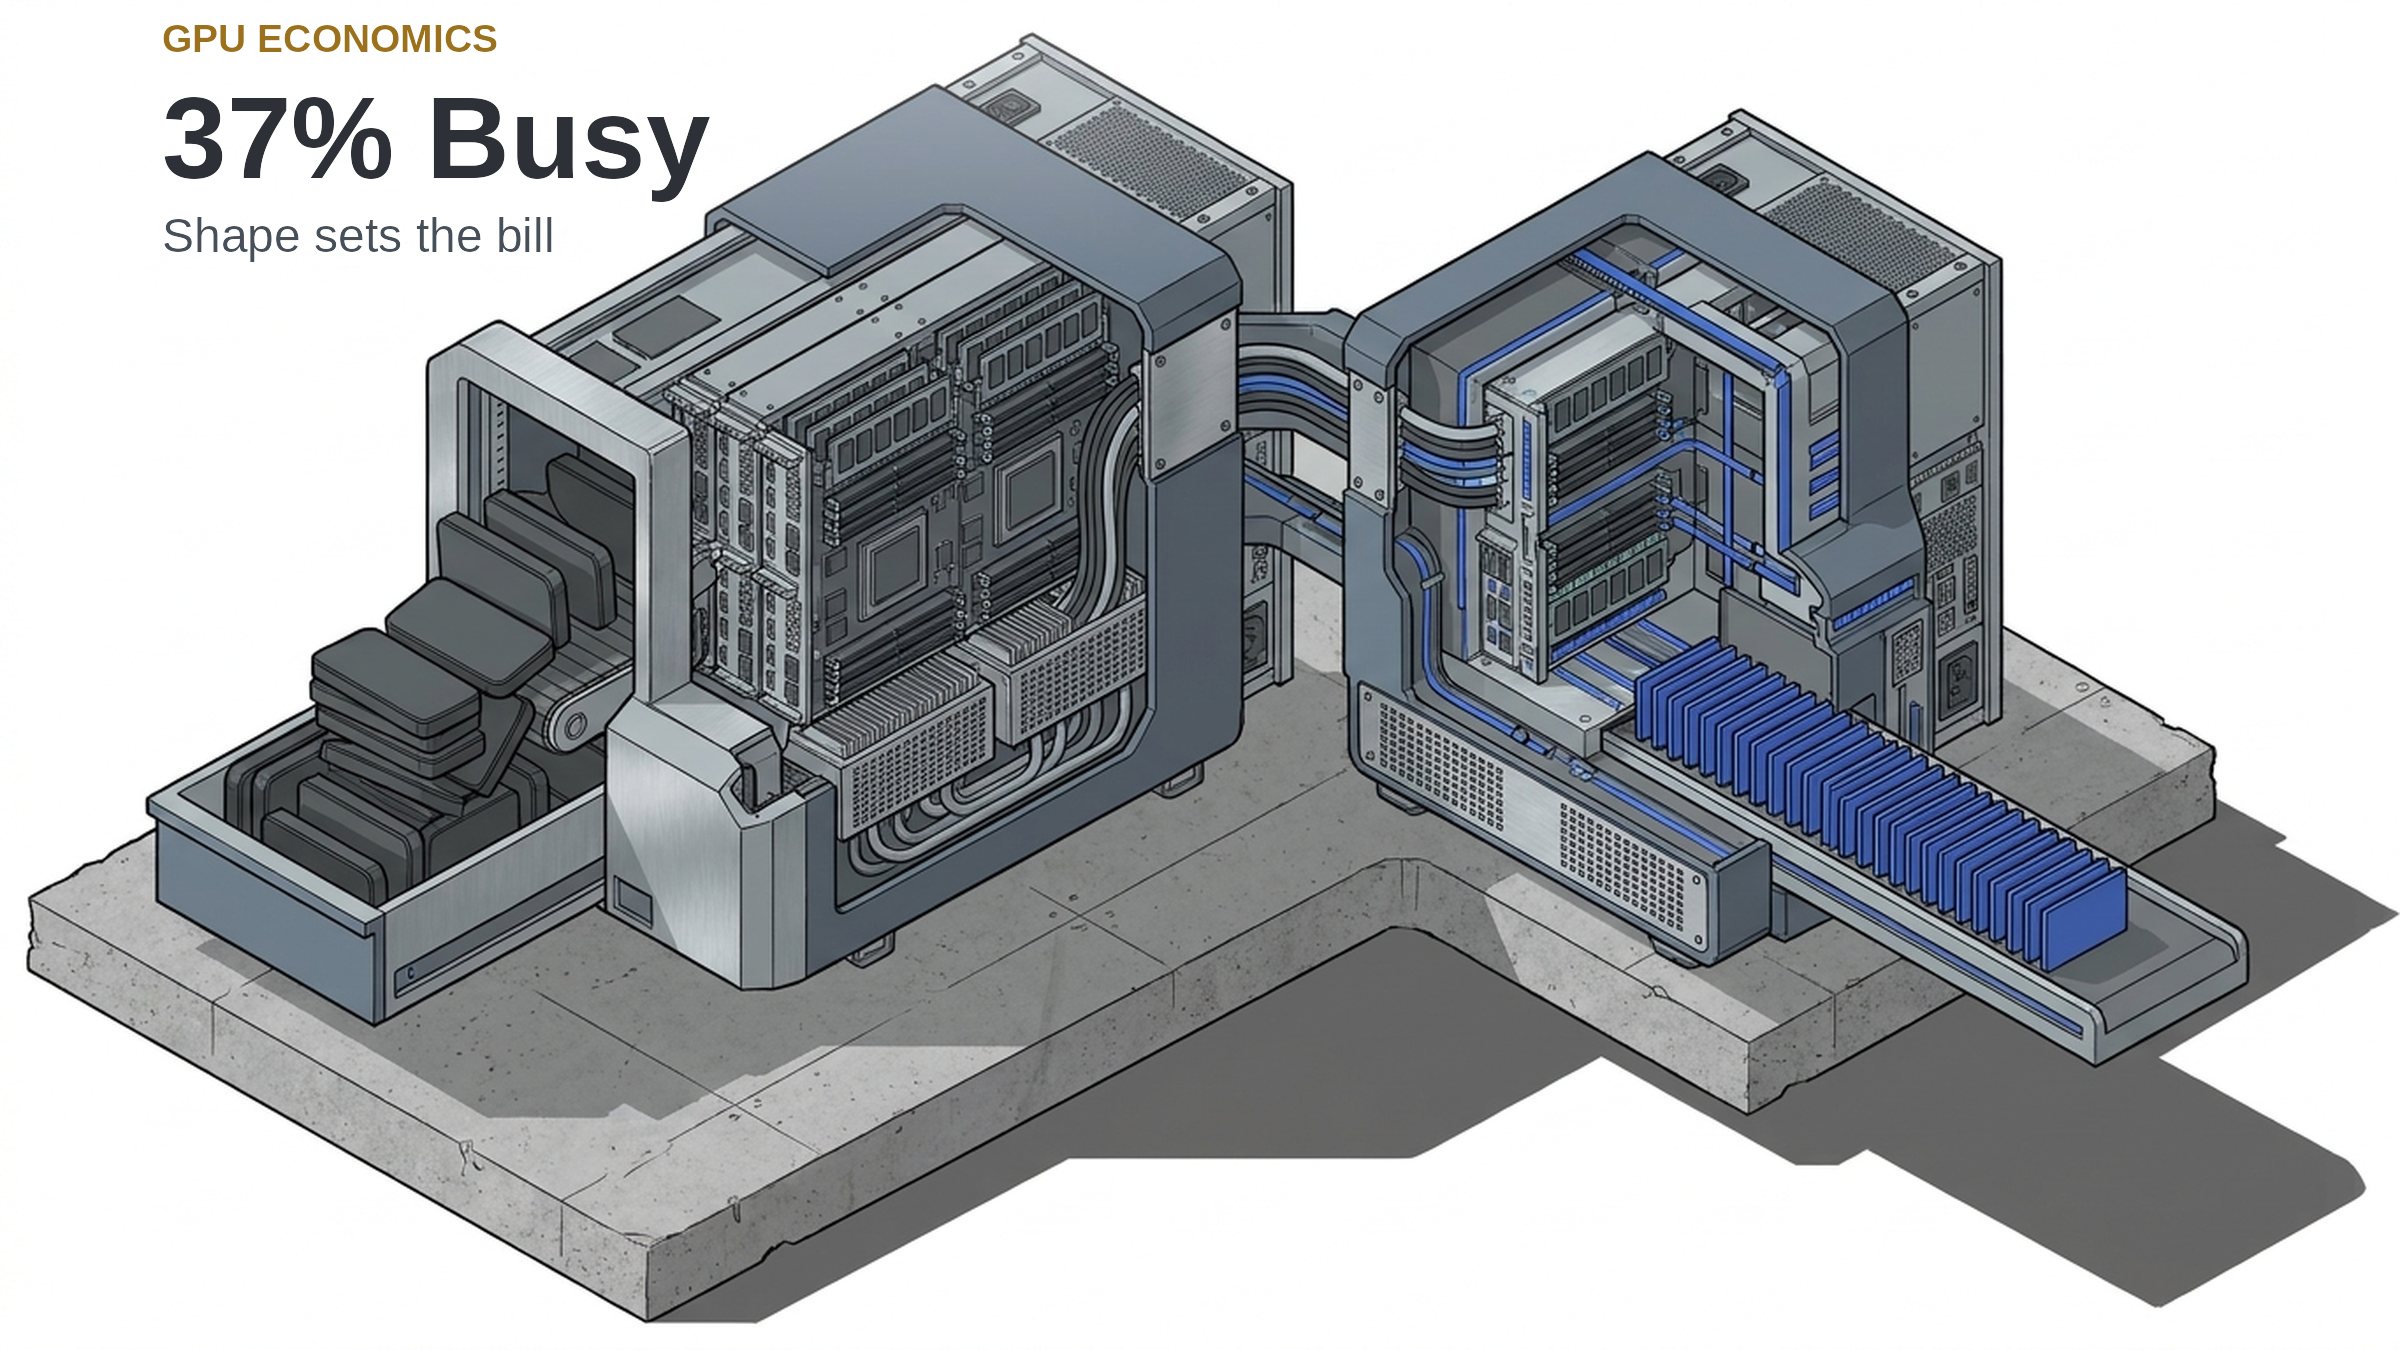
One H100 card, one eight-billion-parameter model, and an output rate that moved by 22.8 times when only the shape of the work changed. Microsoft tested that Graphics Processing Unit (GPU) with the Llama 3.1 8B model under vLLM. The card pushed about 6,067 output tokens a second on a chat-heavy mix, but only about 266 a second on a code-heavy mix [1]. If you rent that card at $3.99 an hour, the chat traffic costs $0.18 per million output tokens while the code traffic costs $4.17 [2]. Claude Haiku 5.5 charges $0.50 per million output tokens for similar routing work, meaning the chat-shaped server breaks even only if you keep it busy for 37% of the month [3].
The big picture:
The buy-versus-rent fight has moved from hardware pricing to pure throughput because a rented card and a hosted small tier now land within a few times of each other, close enough that the workload decides which one wins.
Hosted tiers are sold for fast, high-volume tasks like sorting and routing, which is exactly the work a tuned eight-billion-parameter model handles [3]. The live question is no longer which side is cheaper per token on paper. It is how many tokens an hour the machine actually turns out, and that number belongs to your specific workload rather than the vendor.
The part I keep circling: generating tokens is a memory job before it is a math job. A language model answers by re-reading the data it has already worked out. Long prompts fill that memory store until the card spends its time moving data instead of multiplying [1]. That bottleneck explains the massive output gap on the exact same card and model. Work came in faster than the model could answer, leaving 111 requests waiting in the code test [1].
By the numbers
- $0.18 against $0.50 — The busy case: A card rented at $3.99 an hour and held at 6,067 output tokens a second yields 21.8 million tokens an hour. That puts the cost at 18 cents per million against the hosted tier’s 50 cents [1][2][3].
- $4.17 — The code penalty: At 266 tokens a second, the exact same hour yields just 0.96 million tokens. Even at full saturation, that is 8.3 times the hosted price [1][2][3].
- 37% — The required duty: The machine must hold that peak chat rate for 37% of the month to beat the hosted tier. Adding a quarter of a system administrator’s time pushes that bar to 62% [2][3][5].
- $1,175 — Annual power cost: One kilowatt held for a full year costs about $1,175 at the 2025 commercial average, against $34,952 to rent the card for a year [2][4].
What I’d watch:
- The traffic profile: The two inputs that decide your cost are how many requests arrive at the exact same moment and how long the prompts are compared to the answers. My read: teams that measure these from a live trace price the box right, while teams that guess end up arguing about list rates.
- The spare card: A second card for backup doubles your hourly cost, and every break-even target roughly doubles along with it [2]. The hosted tier already folds that spare capacity into its flat price.
- The peak-shaving setup: Using your own server for the steady base load and the hosted tier for unexpected bursts is what actually keeps a card busy. High utilization is the only lever that improves the math.
- The repricing: Both sides of this division move constantly. The hardware rental list and the hosted small-tier price list are the two lines to check each planning cycle [2][3].
The catch
This benchmark is a vendor lab result. It relies on one card, one model, specific prompt files, and a fixed request rate running on a dedicated cloud machine. It measures a ceiling, not a production environment you actually own [1]. I could be wrong, but my read of the chat test is that it holds the card at an artificially high number of simultaneous requests. It is a fair input for estimating cost, but a poor one for guaranteeing speed.
The quality side is the weaker leg. An eight-billion-parameter open model is not the exact same tool as a hosted small tier. The math above only holds up if the open model clears the quality bar on your own test set [3]. Where it fails, the hosted price is buying skill, not just tokens.
Then there is the reality of the rental rate itself. The community-cloud figure carries no service agreement, while dedicated cards cost significantly more [2]. Add a quarter of one administrator’s time at $24,782 a year [5], and the chat-shaped bar moves to about 62% — a server that has to be truly busy rather than nominally on. Power costs actually cut the other way, but they do not decide this specific call [2][4]. A business case that leans on power savings to justify an AI server is leaning on the wrong number.
When the work has to sit inside a confidential enclave, the tax lands on top of all of it: an enclave overhead measured at 62.8% is charged against the same token rate, so a break-even worked out on plain hardware understates the duty an enclave needs.
At a glance
- The Big Shift: A GPU’s cost per token is no longer a fixed property of the hardware or the price list. It is set entirely by the shape of the work, which can move the output rate by more than twentyfold on the same machine.
- Why It Matters: Buy-or-rent decisions are often made against headline test rates that internal workloads rarely reach. A server bought based on the vendor’s best test row can easily cost several times the hosted price it was meant to beat.
- What I’d Watch: The live measurements that decide whether a hardware reservation actually earns its keep.
- The profile: The rate of requests arriving at the exact same moment, which dictates the speed a box can hold.
- The duty: The share of the month a server runs at peak rate, which turns an hourly price into a per-token cost.
- The spare: The second card a production environment needs for backup, which doubles the required break-even duty.
- The Catch: The benchmark is a lab ceiling run at high concurrency, and the open model may not match the hosted tier on quality. The true cross-over point is something a team measures on its own traffic, never a number taken from a vendor page.
Related reading
- OpenAI just made the agent loop a commodity
- Agentic AI Adoption Soars, But Profits Stall in 2026
- OpenAI’s custom chip beats Nvidia on power
Sources
[1] Microsoft Azure High Performance Computing Blog — “Inference performance of Llama 3.1 8B using vLLM across various GPUs and CPUs”, Cormac Garvey, updated 26 August 2025. https://techcommunity.microsoft.com/blog/azurehighperformancecomputingblog/inference-performance-of-llama-3-1-8b-using-vllm-across-various-gpus-and-cpus/4448420 [2] Runpod — GPU cloud pricing (community cloud list rates, retrieved 27 October 2026). https://www.runpod.io/pricing [3] Anthropic — “Pricing” (Claude API model price table, retrieved 27 October 2026). https://docs.claude.com/en/docs/about-claude/pricing [4] U.S. Energy Information Administration — “Prices and factors affecting prices” (Electricity explained, 2025 annual averages). https://www.eia.gov/energyexplained/electricity/prices-and-factors-affecting-prices.php [5] O*NET OnLine — 15-1244.00 Network and Computer Systems Administrators (2025 wage data). https://www.onetonline.org/link/summary/15-1244.00