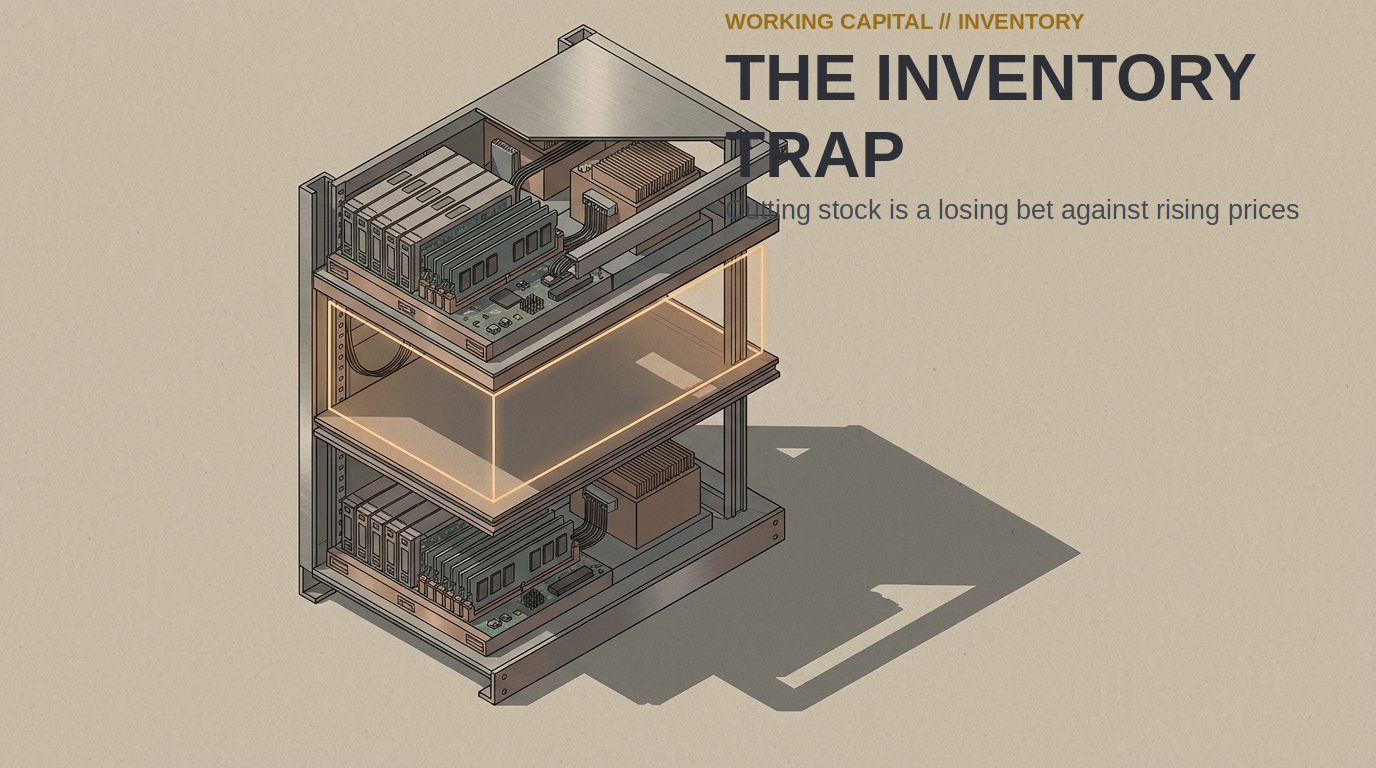
Your finance team’s push to cut inventory is a bet against prices that TrendForce expects to jump 15% in a single quarter [2]. North America’s 1,000 largest public companies closed 2025 with a record $1.94 trillion working-capital gap, and the only metric that improved was how slowly they paid suppliers [1].
The big picture:
The cash conversion cycle (CCC) fell 0.2 days to 38.4 days. That looks like a win until you see where the gain came from [1].
Payables did all the work. Companies paid suppliers 2.9 days slower, while receivables stretched 2.1 days and inventory rose 0.6 days [1].
The cycle did not get healthier. It borrowed from the people who ship to it.
The detail is blunter still. Receivables are the largest and fastest-growing pool at $773 billion [1]. They are up 29% and 40% of the whole, and total receivables grew 11%, nearly twice the pace of revenue [1].
Then the same month brought the other half. TrendForce expects DRAM (dynamic random-access memory) contract prices to rise 10% to 15% in the fourth quarter [2]. NAND (the flash memory inside solid-state drives) should rise 15% to 20% [2].
Suppliers are steering advanced capacity to server parts. That leaves the wider market short of chips, and buyers know it. Computer makers keep buying ahead, because they expect tight supply through 2027 [2].
Supply Chain Dive, citing Omdia, puts the two-year move at up to 400% [5].
What strikes me here is the timing. Finance targets the stock, yet stock is the one input whose replacement price climbs every quarter.
Holding a component that costs 10% more next quarter is a position, not a cost center.
Remove a day of that stock and you write a small short position, a bet that prices will fall. You collect a little financing relief, and you pay the price move to get it.
By the numbers
- $1.94 trillion — Record cash gap: The working-capital gap across 1,000 large North American public companies, up 12% on the prior year [1].
- 2.9 days — Suppliers paid slower: The only gain in the cycle, which offset receivables 2.1 days worse and inventory 0.6 days worse [1].
- $773 billion — Trapped receivables: Money owed by customers, up 29% year on year and 40% of the total [1].
- 10% to 15% — Memory next quarter: The projected rise in DRAM contract prices for the fourth quarter, with NAND at 15% to 20% [2].
What I’d watch:
The first thing I would want answered is why the receivables number escapes the operating review. It is the biggest pool, it grew fastest, and most supply-chain teams touch it at the invoice stage [1].
- The buying ahead of 2027: TrendForce reports that computer makers are already buying past current needs, because they expect shortages to last into next year [2]. The firms holding stock have cover; the ones with the cleanest days do not.
- Where the buffer sits: Merchant wholesalers ended August with an inventory-to-sales ratio of 1.18, against 1.28 a year earlier [4]. Sales rose 15.6% while stock climbed 6.4%, so the upstream tier is already lean and the next cut lands on downstream spokes [4].
- The space the stock needs: Industrial vacancy hit 6.8% in the third quarter, the lowest since the end of 2024 [3]. Absorption hit 76.6 million square feet, and new completions are 13% behind last year’s pace. Extra space is not free any more [3].
My read is that the multi-echelon question has quietly changed shape. It used to be about service levels and freight. For a part re-priced every quarter, it is about which node carries the longest price exposure.
The catch
My read is that the argument flips the moment prices stop rising.
TrendForce is forecasting, not reporting. Its 2027 tightness call rests on capacity staying where it is [2]. A quarter that brings new supply turns that stock into a write-down.
There is a second limit. For short-life goods, seasonal lines and anything with a real obsolescence clock, cutting inventory days is still right. The bet only pays on parts that hold their value and get dearer.
The measure itself is softer than it looks. The survey’s days come from financial statements, so they are dollar days [1]. Part of that 0.6-day rise may be price, not volume [1].
The Census ratio carries its own warning: it is not adjusted for price changes [4].
History is unkind too. Of 1,000 companies, only 98 improved the cash conversion cycle three years running [1]. Nine managed five years, and two managed seven. Gains that rare deserve care.
At a glance
- The Big Shift: North American companies hit a record $1.94 trillion working-capital gap, and the year’s only gain came from paying suppliers slower while receivables and inventory both worsened [1]. In the same month, memory contract prices were projected to rise 10% to 15% in one quarter [2].
- Why It Matters: The main lever finance has left is inventory, and inventory is now a rising asset. A strict days target is a bet against a price curve that moves faster than any carrying charge.
- What I’d Watch: Where the cash actually sits, and which node holds the stock.
- Receivables: Money owed by customers, now 40% of the gap and growing 29% a year, which is a process fix rather than a stock decision [1].
- Buying ahead: Computer makers buying past current needs for a tight 2027, which tells you which firms expect to be short [2].
- Node choice: Wholesalers at 1.18 against 1.28 a year ago, so the upstream tier is already lean and duplicated stock sits downstream [4].
- The Catch: A forecast is not a price. If supply loosens, the same buffer becomes a write-down, and for short-life products the inventory cut is still the right call.
Related reading
- A 1% Mispick Rate Is a Seven-Figure Line Item — more on Supply Chain & Operations
- Higher Rates Meet Historically Lean Inventories — more on Supply Chain & Operations
- Inventory Carrying Cost Is 20–30% a Year, Not Your 7% Borrowing… — more on Supply Chain & Operations
Sources
[1] The Hackett Group, “The Hackett Group Finds Record $1.94 Trillion Working Capital Opportunity Among North America’s Largest Companies,” 5 October 2026 — https://www.thehackettgroup.com/the-hackett-group-finds-record-1-94-trillion-working-capital-opportunity-among-north-americas-largest-companies [2] TrendForce, “AI Server Demand Sustains Memory Contract Price Increases in 4Q26, While Consumer-Side Pressure Persists,” 30 September 2026 — https://www.trendforce.com/presscenter/news/20260930-13258.html [3] Cushman & Wakefield, “U.S. Industrial MarketBeat,” Q3 2026, 14 October 2026 — https://www.cushmanwakefield.com/en/united-states/insights/us-marketbeats/us-industrial-marketbeat [4] U.S. Census Bureau, “Monthly Wholesale Trade Report: August 2026,” CB26-152, 8 October 2026 — https://www.census.gov/wholesale/current/index.html [5] Supply Chain Dive, “5 trends defining consumer electronics supply chains,” 15 October 2026, citing Omdia — https://www.supplychaindive.com/news/5-trends-defining-consumer-electronics-supply-chains/832717/ Desk field note (not a source): an electronics manufacturer holding $2.5 million of regional spare parts carried about $575,000 a year in holding cost, against $85,000 a year for on-demand chartered air freight.